Lisa VanderVoort Data Scientist:
    About     Archive     Feed     Resume

Forecasting Divvy Bike Share Demand During Covid-19

Divvy is Chicago’s bike share system, with more than 600 stations and 6,000 iconic blue bikes across the city of Chicago. Anyone can rent a Divvy bike at a Divvy station and regular users can become subscribers to save on the price. I’ve lived in Chicago for nearly 10 years now, and in my time, I’ve noticed that most Divvy users are commuters who use the bikes to get to work or to the El, or tourists who ride the bikes downtown and along the lakefront trail. However, since Covid-19 began, I noticed an interesting trend in Divvy bikes. During my daily walks with my husband around our residential Logan Square neighborhood, I couldn’t help but notice how many Divvy bikes we saw! It was such a noticeable change and made me wonder if data science could affirm this observation. Is the way people use Divvy bikes different during Covid-19 than before?

Methodology

In order to answer this question, I obtained Divvy bike share data from the City of Chicago data portal from January 1, 2017 to August 31, 2020. In total, there were more than 13 million individual rides! Using the data, I built a PostgreSQL database and used SQLAlchemy to access the data in Python. I transformed the data to represent daily ride aggregations. Finally, I used Facebook Prophet to perform time series forecasting on daily ride demand for the remainder of the 2020 calendar year.

Like pretty much every area of our lives, Covid-19 had a profound impact on the way consumers use Divvy bikes. In my analysis, I found that during Covid-19 more rides take place on weekends than pre-covid 2020. covid_vs_precovid_2020

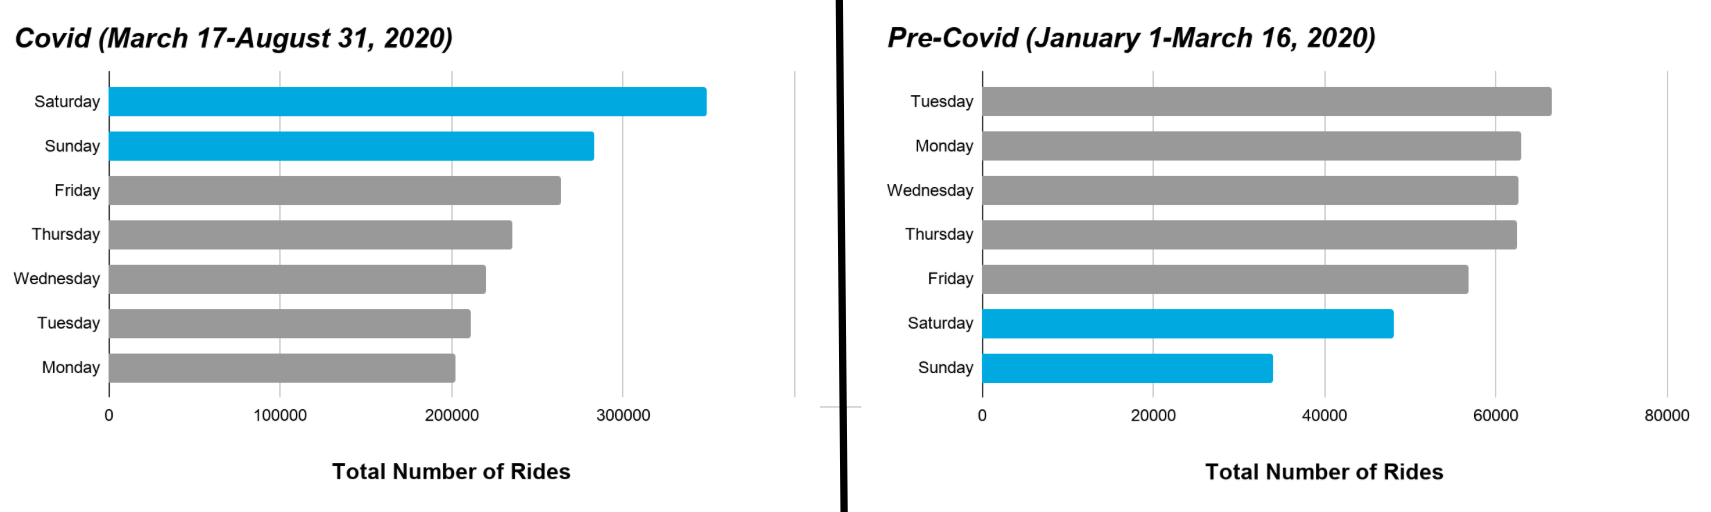
Figure 1: Comparing ride demand by day for 2020

Likewise, if we hold seasonality constant and look at the same dates from 2019, we see that weekends are still uniquely popular during Covid-19. It’s likely weekends are so popular during Covid-19 as people, likely locals, are looking for socially distanced activities to occupy their time. covid_2020_vs_2019

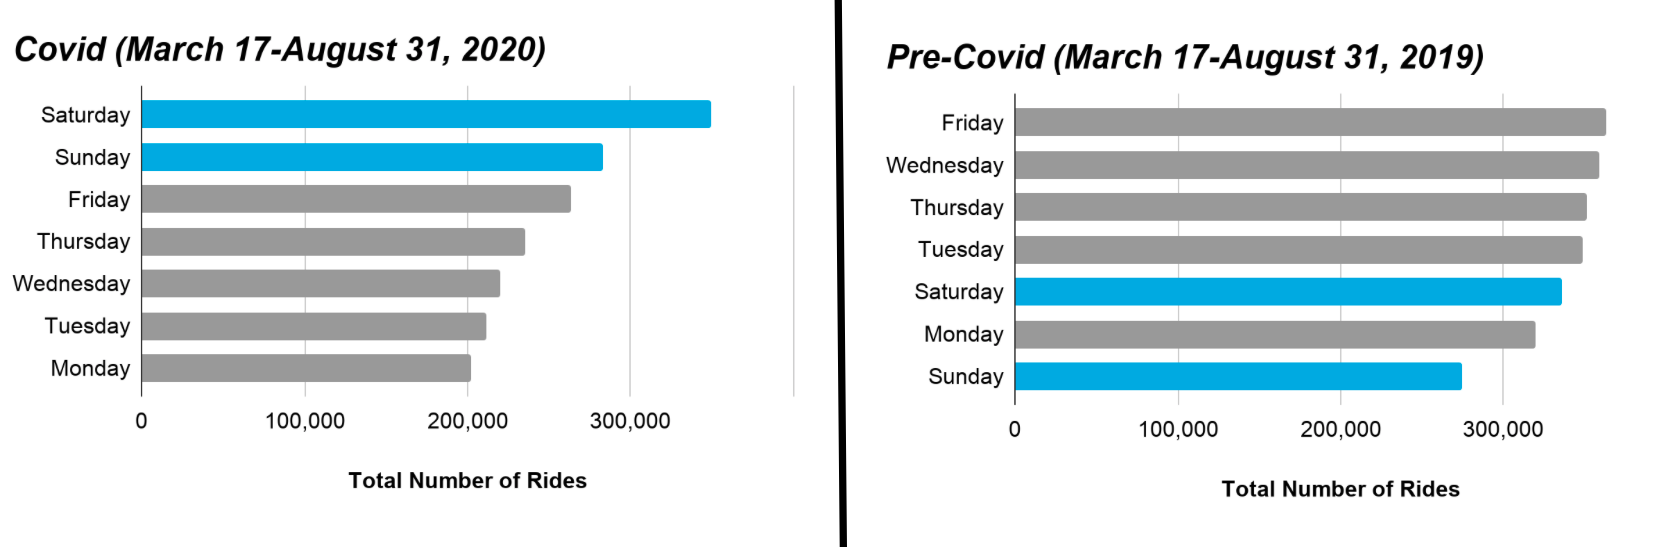
Figure 2: Holding seasonality constant, weekends are still uniquely popular

Divvy ride demand follows clear Chicago weather seasonality, with ridership spiking in the summer months and dropping in the bitter cold winter. However, in 2020, you can see that Covid-19 had a noticeable difference on demand compared to the past. Chicago followed a phased shutdown and reopening in response to Covid-19. Phase 1, which was the initial strict stay-at-home order, was from March 17-April 30, 2020. During this time, you’ll notice a sharp decline in rides. Phase 2, which was from May 1, June 2, 2020 was a continued stay-at-home order, but with safety precautions for going outside. As a result, there’s an initial increase in ride demand. Phase 3, which was from June 3-25, 2020, was when Chicago cautiously reopened. Here, there’s again an increase in ride demand. And finally, Phase 4, that started on June 26 and which is where Chicago is currently at, is the gradually resume phase where most places have opened with mask, social distancing and capacity restrictions. In this phase, for the first time since shutdown, demand is comparable to the past. rolling_averages

Figure 3: Sharp decline and rapid rise in bike demand in 2020 connected to Chicago’s phased Covid-19 response

Results

Given the rapid and unique changes to ride share demand brought on by Covid-19, this posed quite a challenge for time series forecasting. I chose to forecast with Facebook Prophet. Prophet is an additive model built specifically by Facebook for non-linear, seasonal data. It’s robust to shifts in trend and outliers, which Covid-19 brought a lot of. I forecasted daily ride demand across all Divvy stations in Chicago and used all data I had available from 2017 to 2020. I chose to optimize my forecasting with Mean Absolute Error (MAE) and Root Mean Square Error (RMSE) to see how many rides by model was off by each day.

After starting with a baseline, out of the box model, I added my first two Prophet custom covid seasonality: weekly seasonalities. In Prophet, a weekly seasonality is a trend in demand that repeats every week. The first weekly seasonality I created was a during covid seasonality which used dummy variables to show the unique spikes in demand on weekends and dips in demand on weekdays. On top of that, I added a pre-covid seasonality which again used dummy variables to show the weekday spikes in demand and weekend dips that were regular before Covid-19. Using just these custom seasonalities, I saw the MAE and RMS drop which meant the model had less error and was performing better. Then, I layered, custom yearly seasonalities for each phase of Chicago’s reopening. Ultimately, I was able to optimize my model by adding all covid seasonality with the exception of Phase 4. For my model, the MAE means that on average, my model was off by a little more than 2,700 rides per day. phase_table

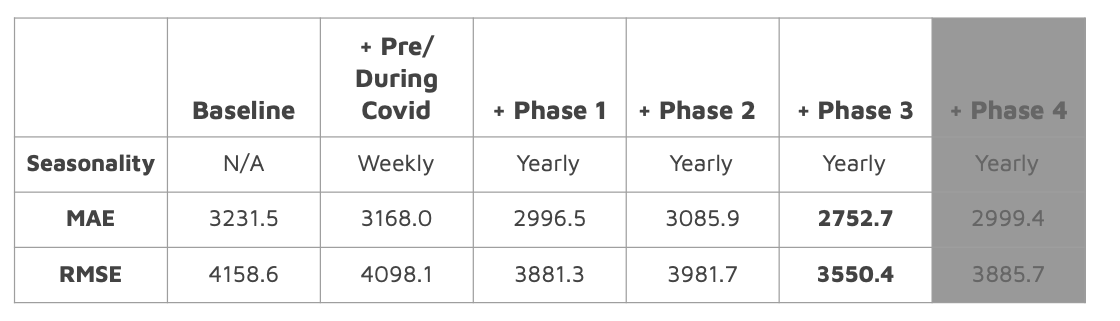
Figure 4: Error metrics for each iteration of modeling with phases

Most notably, my final model with added covid seasonality forecasts higher demand than the baseline model. This is important for Divvy to know so they can make sure to have enough bikes to meet demand in the upcoming months. divvy_projected_baseline_vs_optimal

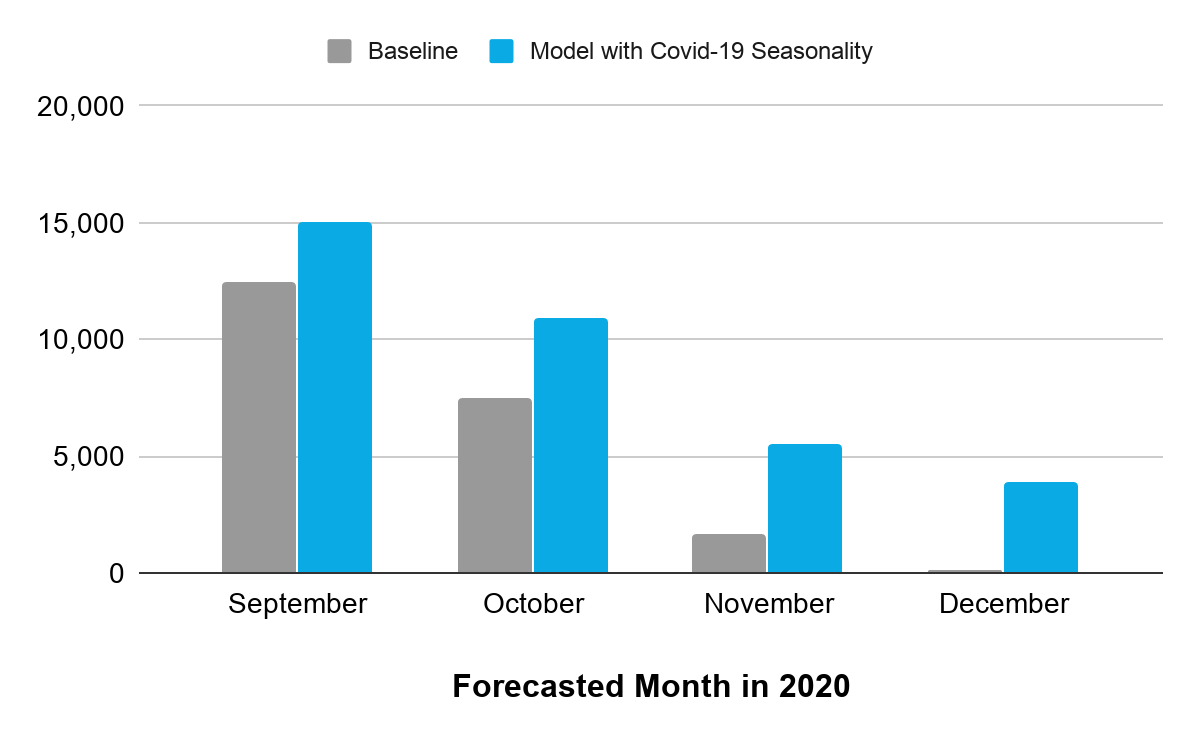
Figure 5: Model with Covid-19 seasonality forecasts higher daily demand through the end of the year

Using my analysis and visualizations I built in Tableau, I have a few recommendations to Divvy in how to address the change in demand for the remainder of 2020. First, I recommend that Divvy increase the number of bikes available in residential areas of Chicago. Rides are significantly up at stations in more densely populated residential areas, particularly along the lake and south side of the city. increase_map

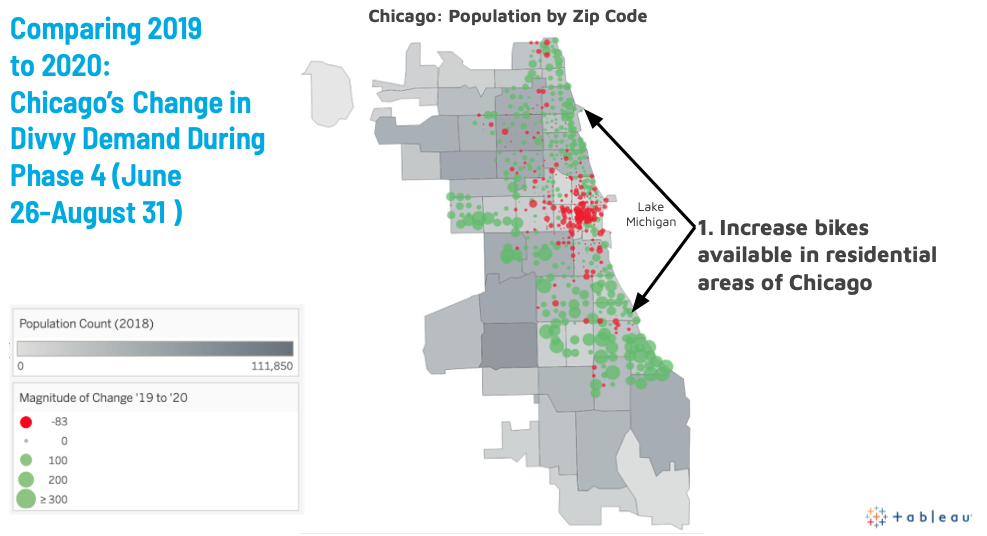
Figure 6: Demand at stations in more residential areas has increased from this time in 2019

Likewise, my second recommendation is to reduce the number of bikes available at stations in the downtown loop area, as ridership is significantly down. decrease_map

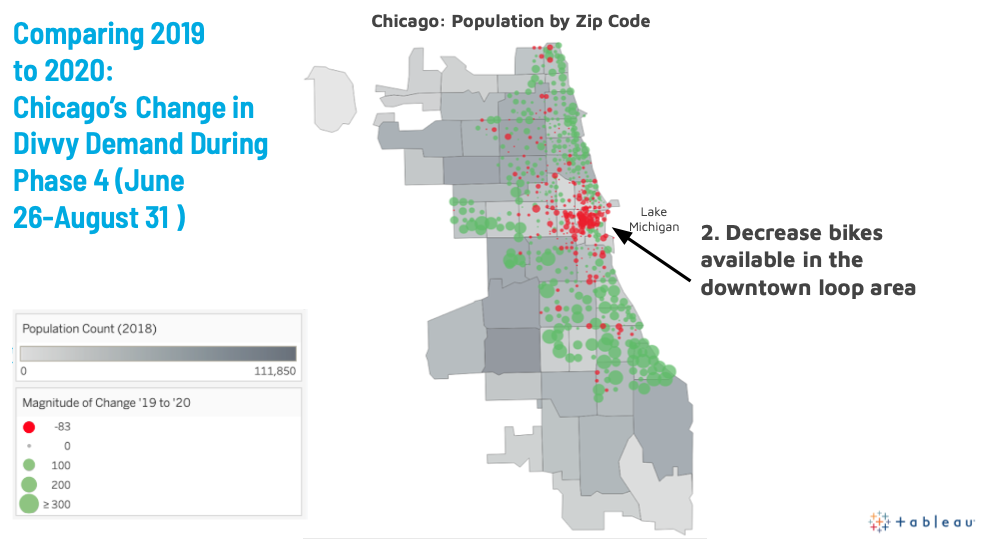
Figure 7: Demand at stations in less residential areas (downtown loop) has decreased from this time in 2019

My third recommendation to Divvy is to increase bike availability on weekends since they’re uniquely popular during Covid-19. ![covid_by_week](http://lvandervoort89.github.io/images/covid_by_week.png

Figure 8: Unique weekend popularity during Covid-19

Tableau Visualizations

I created a full interactive Tableau Story that you can checkout on my Github. It includes bike share demand by station for each of Chicago’s phases of reopening.

You can check out my code for my project on my Github.

Analyzing How Millennial Women Spend Time & Money via the Refinery29 Money Diaries

In June 2018, my husband and I paid off $117,000 in my student loans! It was a freeing and life changing experience, but not in the ways you might imagine. One of the most profound, yet unexpected ways it changed me was the way I talked with my girlfriends about money. I no longer felt afraid to talk about my massive student loan debt or some of the choices and sacrifices my husband and I made to pay off our debt in about 2 years (on educator salaries nonetheless). Together, we started talking, asking questions, and sought advice around salary negotiations, debt, and investing. It sparked an obsession with personal finance and somewhere in my journey, I found Refinery29’s Money Diaries and became HOOKED.

If you’re not familiar with Refinery29’s Money Diaries, it’s a series on the Refinery29 website where millennials share their personal financial information and a week in the life, including what they do and how much they spend. While it’s fascinating to creep on the lives of other people, I actually think can be a powerful financial educational tool for millennials! Seeing how much others make and what they do with their money can inspire others to take a look at their own finances and make some positive changes! My ultimate goal was to build a Money Diary recommender to support others on their personal financial journeys!

Methodology

For my analysis, I used Beautiful Soup and Selenium to scrape 476 money diaries from the Refinery29 website. I scraped diaries from January 18, 2019 through June 3, 2020. The diaries are featured on the Refinery29 website a few times per week. Recently, Refinery29 has updated their policy and posting schedule for the money diaries, so I intentionally selected diaries before that change, since it was relatively new.

I was able to obtain 2 types of information from the diaries: metadata and text data. The diarists’ metadata included things like the age, occupation, location, income, rent, and various other monthly expenses. Although this information looks standardized on the Refinery29 website, it’s dependent on what the diarist provides and the detail they go into. For this reason, I chose to only select age and salary, as this data needed extensive (and often manual) cleaning. The diarists’ text data is the actual bulk of the diary. This includes what the diarist does and how much they spend at various times throughout the day throughout the seven days.

The diarists included in my sample have an average age of 27.7 and nearly 90% are millennials between 24-39. The average salary is $72,415, 45% live in a high cost of living area (as measured by proxy of living in one of the top 25 most populous cities in the United States in 2019), 10% live internationally during their diary, and 1% live a nomadic lifestyle where they travel the US.

With the data collected, I used Natural Language Processing (NLP) to analyze how millennial women spend their time and money. I then used topic modeling and clustering to identify groups of diarists and gather information about what they write about.

Results

Topic Modeling on All Diarists
First, I performed topic modeling on all of the diarists. Through a lot of trial and error, I found topics and words that made the most sense using Non-negative Matrix Factorization (NMF) with noun part of speech tagging and Count Vectorizer. The diary entries could be categorized into 8 topics: friends/socializing, cooking/food, work, dogs, self-care, family, husband, and baby. I thought these results made a lot of sense given that millennials are 24-39! I was eager to do further analysis and gain more insights into the different types of millennials in the diaries. Top_10_words_all_diarists

Figure 1: Top 10 words in each topic for all diarists

Clustering
I then decided to do clustering on the diarist metadata to learn about the different types of millennials and then do topic modeling on the individual clusters to gain insight into the nuances of the daily lives of the diarists. I performed K-means clustering on the age and salary metadata and was able to break the diarists into 5 groups.

Figure 2: The 5 clusters and centroids for each

I identified the clusters as early 20s entry-level earners, late 20s average earners, late 20s high earners, mid 30s average earners, and mid 30s high earners.
Cluster_metadata

Figure 3: Demographic information for each of the 5 clusters

Top Modeling on Clusters
Now that I had each of my clusters, I performed additional topic modeling on them. Once again, I found the most success with Non-negative Matrix Factorization (NMF) with noun part of speech tagging and Count Vectorizer. I found some really interesting insights in the topic modeling for each of these clusters! Many of the topics the early 20s entry-level earners wrote about included self-discovery and self-care. Comparing the late 20s clusters, the average earners wrote more about immediate family and home, while high earners wrote more about socializing and self-care. Lastly, both mid 30s clusters wrote a lot about family, but the high earners included more about self-care.

Cluster_topics

Figure 4: Identified topics for each of the 5 clusters

Recommender

I used my data and results to create a Money Diary Recommender using Streamlit. The recommender has the user input their age, salary, and a mini diary entry of what they did the previous day. It then uses the user’s age and salary to cluster them to the original diarists, and then based on the assigned cluster, performs cosine similarity on the diaries in the cluster and returns links to 3 diaries that are most similar to the user. My hope is that people will use this recommender and be inspired or learn some ideas on how to manage their finances.

If you haven’t already, go read some Refinery29 Money Diaries!

You can check out my code for my project on my Github.