WTWY Street Team Analysis and Optimization
Introduction
On the first day of the Metis Data Science Bootcamp we were tasked with supporting WomenTechWomenYes (WTWY), a fictional nonprofit looking for support with optimizing street team placement at MTA stations in order to attract people to attend their annual gala. Specifically, WTWY wanted to fill their gala with individuals passionate about increasing the participation of women in technology and to build awareness and reach of their organization. The street teams will collect email addresses and those who sign up are sent free tickets to the gala.
Our team was particularly drawn to 2 parts of the mission of WTWY: finding individuals passionate about increasing the participation of women in technology and building awareness and reach of the organization.
Methodology
We pulled MTA turnstile data for the 2 months prior to the gala (which takes place at the start of summer) and specifically used data from March 30-May 31, 2019 since we thought this would be the time when street teams would target attendees.
We then decided to use our knowledge of universities and tech companies in NYC to provide context to our data. For universities, we specifically looked at universities in NYC that had technology programs. For tech companies, we looked at companies with the largest square footage of office space in NYC, operating under the assumption that, considering real estate costs, the larger the office space, the larger the company. To narrow both of these lists, we chose a subset of 5 from each category. For universities, we chose Columbia, NYU, City College of New York, Fashion Institute of Technology, and Cooper Union for Advancement of Science and Art. For tech companies, we chose WeWork, Google, Facebook, Spotify, and Amazon.
We chose to analyze our data from broad to specific. First, we examined cumulative entries overall, then filtered down to day of week, and then more specifically to time of day, as we had reason to believe we would find interesting and unique trends at each of these points.
Cleaning & Exploring the Data
The MTA turnstile dataset is a great dataset to work with, but it is truly challenging and messy. One way we cleaned the data was by removing duplicates. Additionally, we made the decision to remover data from counters whose audits had to be recovered, as we noticed they were not always consistent with the counter readings immediately before or after the recovery. We then spent a significant amount of time getting to know the MTA transit system and how to distinguish between stations that were grouped together under the same name, but were actually separate stations in real life. Due to time constraints and the sheer quantity of data, we focused on the stations that were coming up in top 15 list, like Penn Station, 23 St, 125 St, and 86 St.
Results
The bar chart below represents the stations with the highest foot traffic between April-May 2019. Many of these stations are large, central stations located in Manhattan which makes sense as to why they have the highest total traffic over the time period.
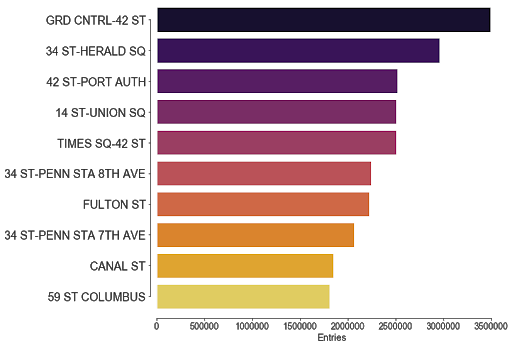
Figure 1: Busiest MTA stations between April-May 2019
The line plot below shows traffic over a typical week in April for the busiest stations from April 1-8, 2019. From this plot, you can see a clear pattern throughout a week. Weekdays (2019-04-01 - 2019-04-06) see more traffic than weekends (2019-04-07 - 2019-04-08). Weekdays also follow a predictable schedule; traffic spikes in the morning and evenings, which likely correlate with morning and evening work commutes. Furthermore, we see a weekend dip in most stations.
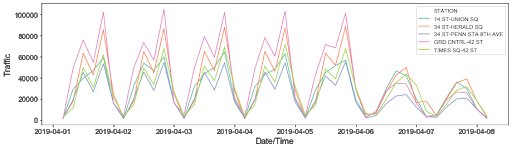
Figure 2: Line plot showing typical weekday traffic
We then analyzed our MTA station data in relation to proximity to our sample of universities and tech companies. We used the latitude and longitude coordinates of each of the stations and calculated the distance of each to our sample of universities and tech companies. The table below shows stations that are within 1km (or roughly walking distance) to 4 or more universities or tech companies.
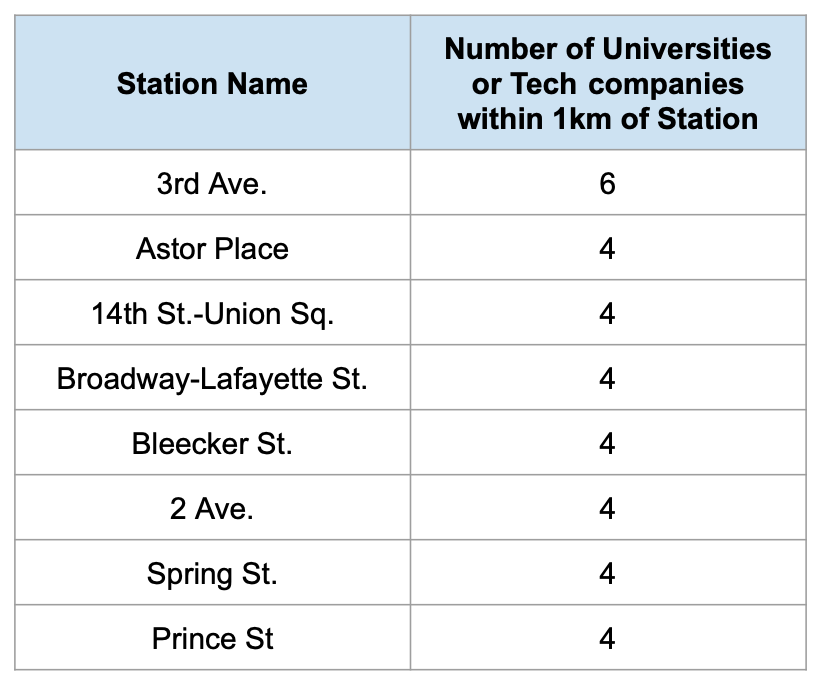
Figure 3: List of stations closest to major tech companies
When we plotted this data based on number of entries to the station overall, we noticed that 14 St-Union Square emerged as one of the busiest stations that is also in close proximity to universities and tech companies. This means that street teams placed at this stop will have a greater likelihood of finding people passionate about supporting women in technology.
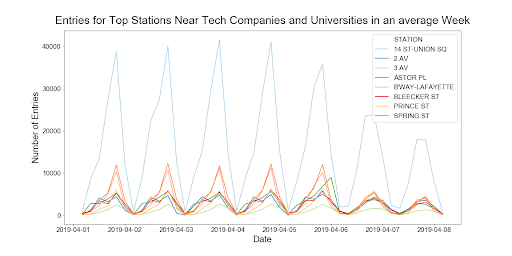
Figure 4: Daily traffic for busiest stations near tech companies
Conclusions
We wanted to give WTWY 3 actionable steps of how to implement this data:
-
For street teams, prioritize weekdays, since they are the busiest, particularly in the evenings. If there is weekend capacity for street teams, prioritize the afternoons.
-
We recommend placing street teams at the following 8 stations (note that 14 St-Union Sq is on both lists).
Top 5 Busiest Stations Overall:
- Grand Central-42 St
- 34 St-Herald Sq
- 42 St-Port Authority
- 14 St-Union Sq
- Times Sq-42 St
Top 4 Busiest Stations Closest to Tech Companies & Universities:
- 14 St-Union Sq
- Broadway-Lafayette St.
- Spring St.
- 3 Ave.
-
Finally, we believe that 14 St-Union would be one of the best stations to position street teams since it’s within 1km of tech companies (WeWork and Spotify), 1km of universities (FIT and Cooper Union), and it’s one of the busiest stations, even on weekends.
Future Work
In the future, we would like to create a time series analysis using data from April-May over multiple years to see how consistent or varied the traffic trends are. Additionally, we would like to dig deeper into the data and pinpoint specific entrances at large stations (like Time Square) that can have multiple street entrances feeding into the same station. Lastly, we would like to identify trends and the impact of station traffic in relation to season events, such as university breaks or annual tech conferences that might increase/decrease the concentration of people interested in WTWY.