Predicting University Graduation Rates
I was a first-generation college student and spent the first decade of my professional career working with many students who would also be first-generation college students. Most of the schools I worked at, Title 1 charter schools, had a big push for college. We talked about college non-stop and would find any way/shape/form we could infuse college into our classroom and school culture. As I became more seasoned in my career and my former students graduated high school and matriculated in college, I noticed something quite alarming. A large number of them didn’t finish. This was a source of reflection for me. The schools I worked at began to address this gap between college matriculation and college graduation by using data on their alumni to change practices in the schools. However, from a data science perspective I’ve wondered, how pervasive is this problem?
In my research, I found that the number of students who graduate from college after matriculating, is lower than I would have expected.
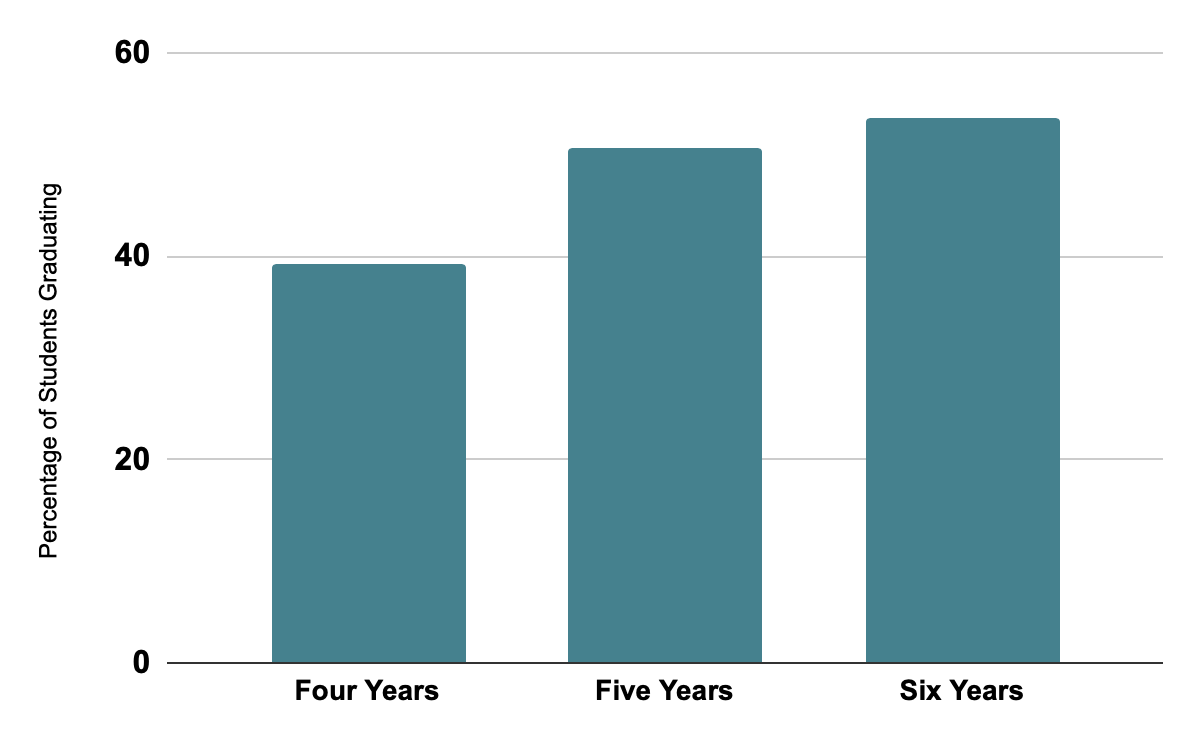
Figure 1: Graduations rates across all universities in dataset
What are the predictors of graduation rates at universities? With that information, both universities and high schools can better set students up for success to complete their degree.
Methodology
In order to answer this question, I scraped data on more than 1,000 4-year public and private not-for-profit universities in the United States from College Results Online. In order to predict each university’s five-year graduation rate, I used many features about the universities like the number of undergrads, the percent of part-time students, tuition, test scores of applicants, percent of applicants admitted, and first-year retention rate. I was able to separate the features into 3 separate categories: university features (number of undergrads, percent of students part-time, percent of students who are from underrepresented minority groups, in-state tuition, and out-of-state tuition), applicant specific features (percent of applicants admitted, GPA of applicants, median verbal SAT score, median math SAT score, median ACT composite score, and whether an admission test was required for admission), and first-year undergrad specific features (percent of Pell Grant recipients among freshmen, and the first-year retention rate). Below you’ll see the correlation, or strength of relationship, of each feature to 5-year graduation rates. The blue bars represent a negative correlation and the red a positive correlation.
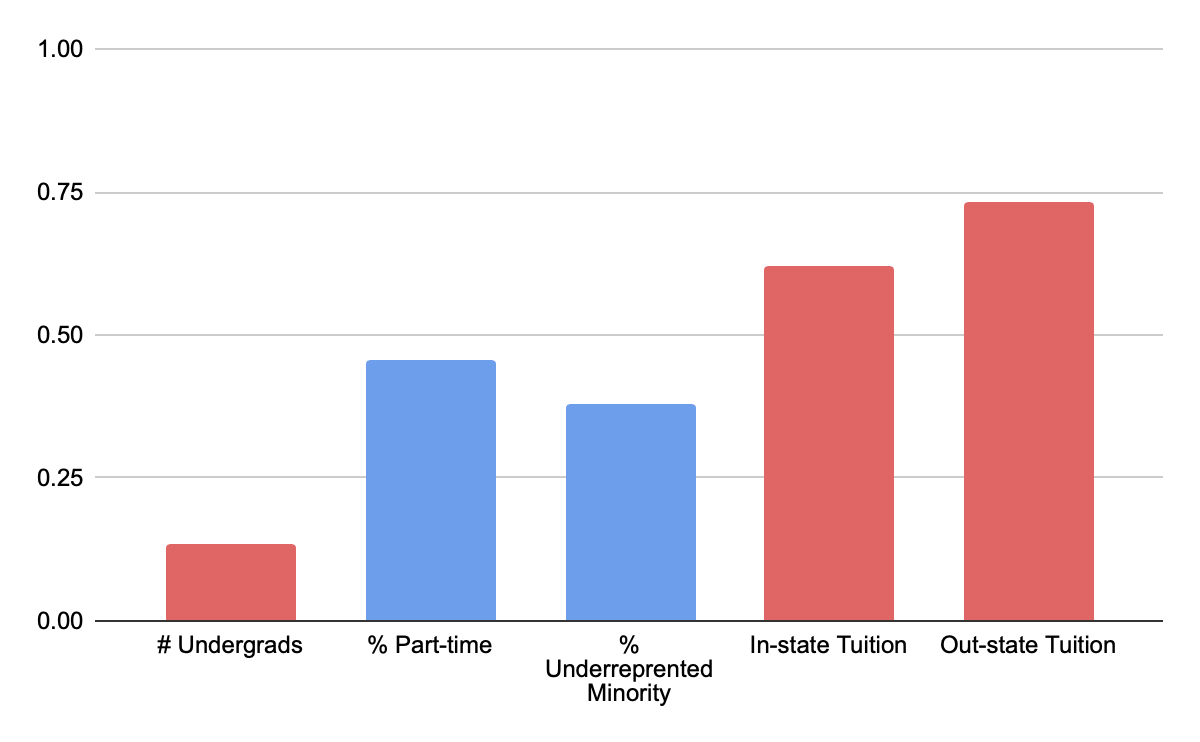
Figure 2: Correlation between university features and 5-year graduation rate
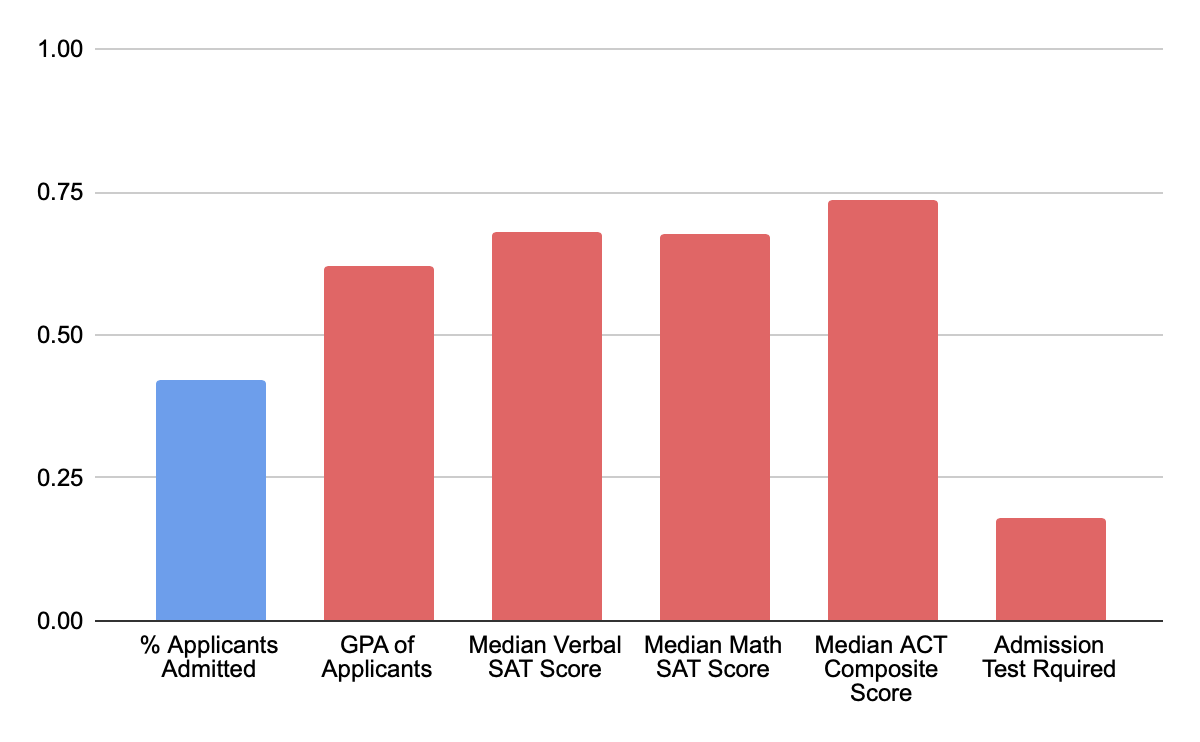
Figure 3: Correlation between applicant features and 5-year graduation rate
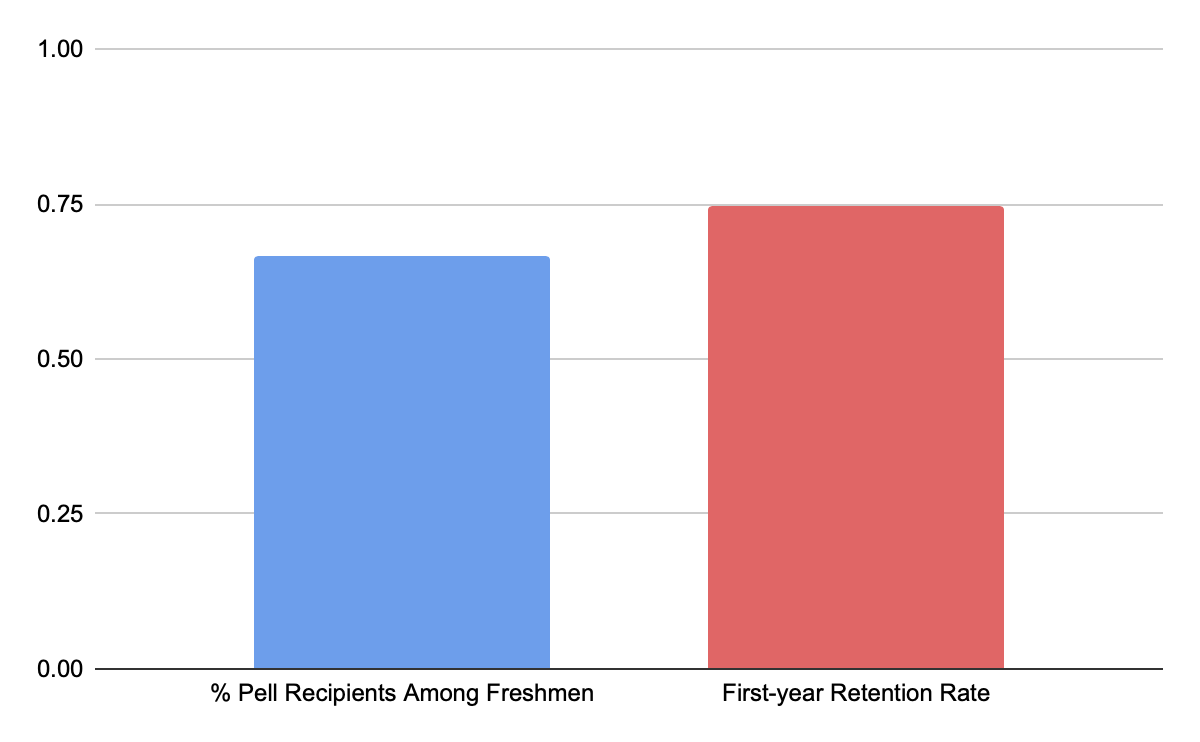
Figure 4: Correlation between first-year undergrad features and 5-year graduation rate
In preparing the data for modeling, I noticed that many of the university features are collinear, meaning they’re related to each other. In order to reduce the multicollinearity (and through a lot of feature selection trial and error), I ultimately selected the number of students who are part time, out-of-station tuition, as the percent of applicants admitted, the GPA of applicants, the median ACT composite score of applicants, the percent of Pell Grant recipients among freshmen, and the first-year retention rate as features to include in the final model. Additionally, I did some feature engineering and added a multiplicative interaction term between the median ACT composite score and whether a university requires standardized test scores.
Results
After trying modeling with simple linear regression, ridge regression, and LASSO regression, I chose to model the data with simple linear regression with standard scaled features. I was able to optimize my model to have a R2 score of 0.74 and a mean square error of 112.4. The R2 value tells me that there is a strong relationship between the actual and predicted graduation rates.
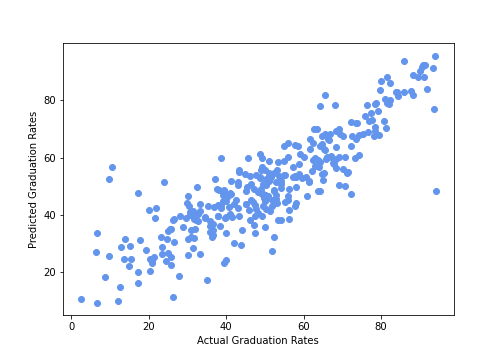
Figure 5: Strong relationship between actual and predicted graduation rates
Additionally, further analysis of my model and results show random scatter in the residuals plot and a mostly normal Q-Q plot.
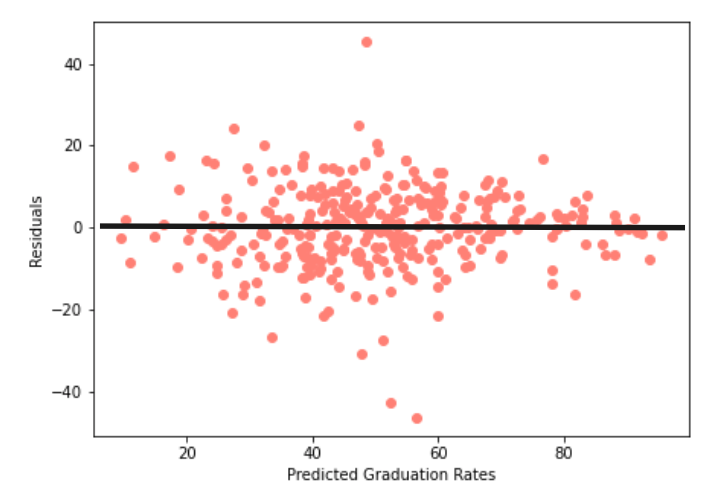
Figure 6: Random scatter in residuals
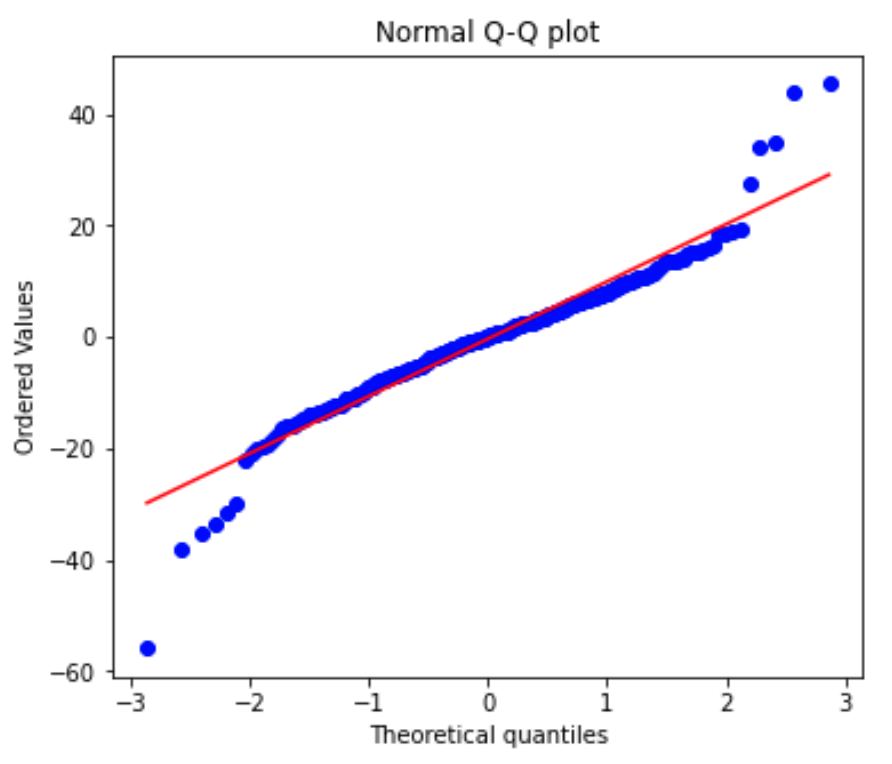
Figure 7: Normal Q-Qplot
I found the most impactful features of the model to be out-of-station tuition, median ACT composite score, the percent of Pell Grant recipients among freshmen, and the first-year retention rate. For universities looking to improve their graduation rates, I would recommend thinking about these areas, but would caution the conclusions that can be drawn from them. Overall, I the model was able to provide valuable information about what leads to high university graduation rates and I suggest more future work to determine the extent to which improving these features can raise rates.
You can check out my code for my project on my Github.