Analyzing How Millennial Women Spend Time & Money via the Refinery29 Money Diaries
In June 2018, my husband and I paid off $117,000 in my student loans! It was a freeing and life changing experience, but not in the ways you might imagine. One of the most profound, yet unexpected ways it changed me was the way I talked with my girlfriends about money. I no longer felt afraid to talk about my massive student loan debt or some of the choices and sacrifices my husband and I made to pay off our debt in about 2 years (on educator salaries nonetheless). Together, we started talking, asking questions, and sought advice around salary negotiations, debt, and investing. It sparked an obsession with personal finance and somewhere in my journey, I found Refinery29’s Money Diaries and became HOOKED.
If you’re not familiar with Refinery29’s Money Diaries, it’s a series on the Refinery29 website where millennials share their personal financial information and a week in the life, including what they do and how much they spend. While it’s fascinating to creep on the lives of other people, I actually think can be a powerful financial educational tool for millennials! Seeing how much others make and what they do with their money can inspire others to take a look at their own finances and make some positive changes! My ultimate goal was to build a Money Diary recommender to support others on their personal financial journeys!
Methodology
For my analysis, I used Beautiful Soup and Selenium to scrape 476 money diaries from the Refinery29 website. I scraped diaries from January 18, 2019 through June 3, 2020. The diaries are featured on the Refinery29 website a few times per week. Recently, Refinery29 has updated their policy and posting schedule for the money diaries, so I intentionally selected diaries before that change, since it was relatively new.
I was able to obtain 2 types of information from the diaries: metadata and text data. The diarists’ metadata included things like the age, occupation, location, income, rent, and various other monthly expenses. Although this information looks standardized on the Refinery29 website, it’s dependent on what the diarist provides and the detail they go into. For this reason, I chose to only select age and salary, as this data needed extensive (and often manual) cleaning. The diarists’ text data is the actual bulk of the diary. This includes what the diarist does and how much they spend at various times throughout the day throughout the seven days.
The diarists included in my sample have an average age of 27.7 and nearly 90% are millennials between 24-39. The average salary is $72,415, 45% live in a high cost of living area (as measured by proxy of living in one of the top 25 most populous cities in the United States in 2019), 10% live internationally during their diary, and 1% live a nomadic lifestyle where they travel the US.
With the data collected, I used Natural Language Processing (NLP) to analyze how millennial women spend their time and money. I then used topic modeling and clustering to identify groups of diarists and gather information about what they write about.
Results
Topic Modeling on All Diarists
First, I performed topic modeling on all of the diarists. Through a lot of trial and error, I found topics and words that made the most sense using Non-negative Matrix Factorization (NMF) with noun part of speech tagging and Count Vectorizer. The diary entries could be categorized into 8 topics: friends/socializing, cooking/food, work, dogs, self-care, family, husband, and baby. I thought these results made a lot of sense given that millennials are 24-39! I was eager to do further analysis and gain more insights into the different types of millennials in the diaries.
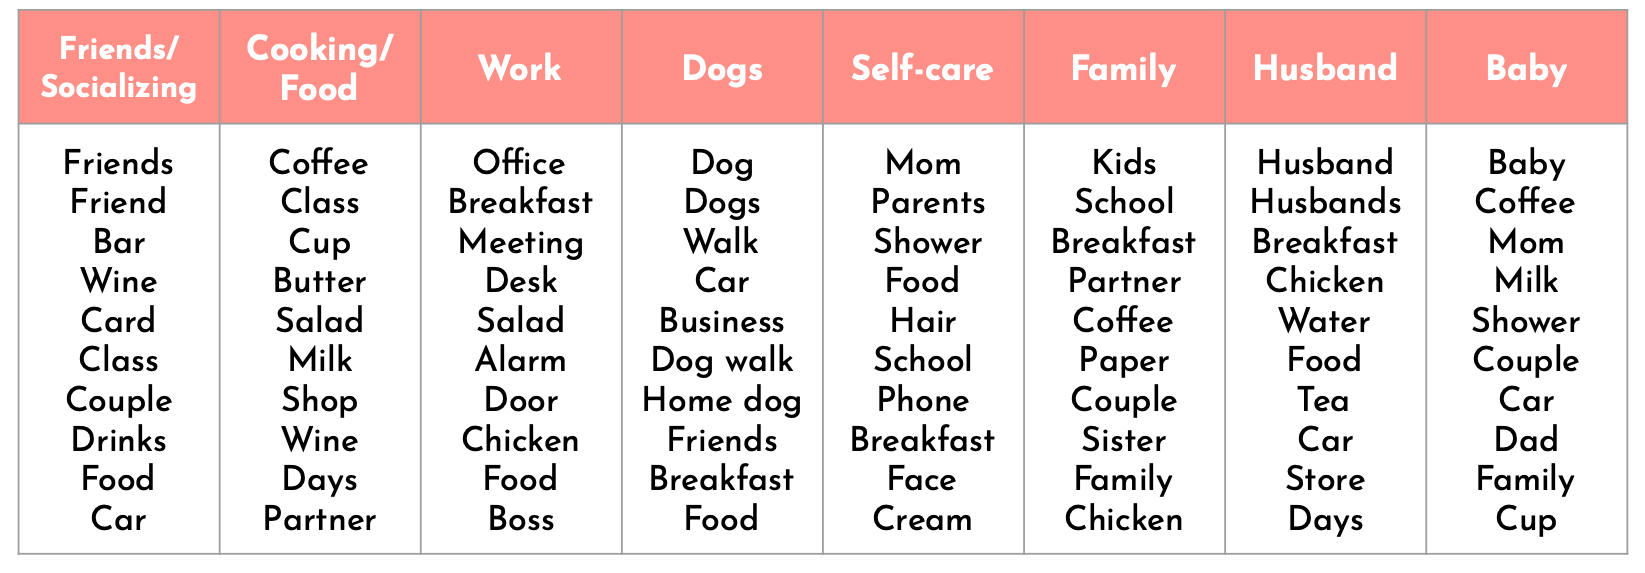
Figure 1: Top 10 words in each topic for all diarists
Clustering
I then decided to do clustering on the diarist metadata to learn about the different types of millennials and then do topic modeling on the individual clusters to gain insight into the nuances of the daily lives of the diarists. I performed K-means clustering on the age and salary metadata and was able to break the diarists into 5 groups.
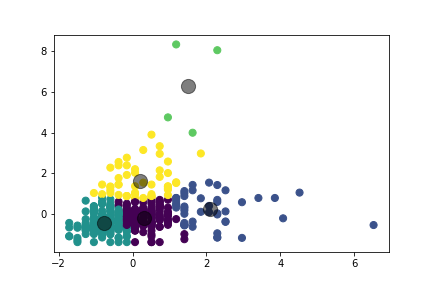
Figure 2: The 5 clusters and centroids for each
I identified the clusters as early 20s entry-level earners, late 20s average earners, late 20s high earners, mid 30s average earners, and mid 30s high earners.
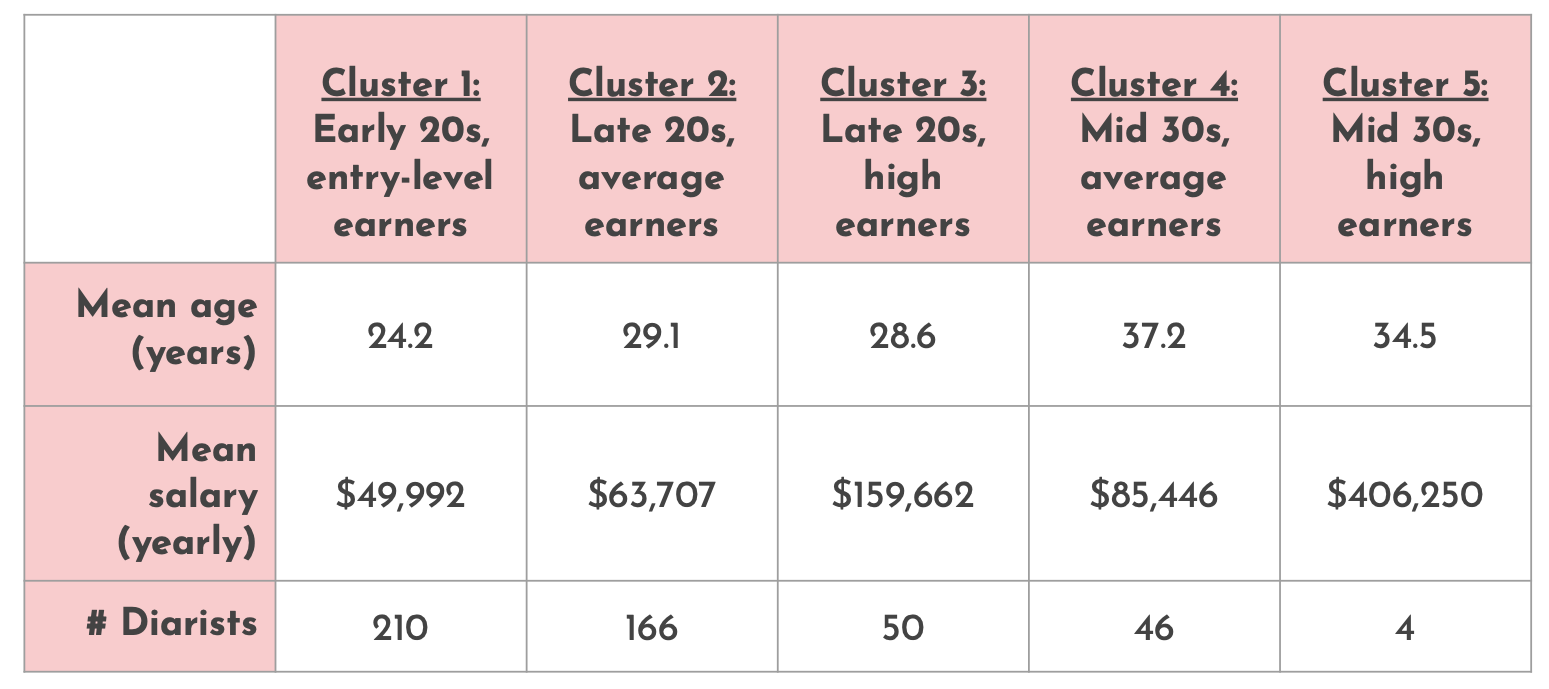
Figure 3: Demographic information for each of the 5 clusters
Top Modeling on Clusters
Now that I had each of my clusters, I performed additional topic modeling on them. Once again, I found the most success with Non-negative Matrix Factorization (NMF) with noun part of speech tagging and Count Vectorizer. I found some really interesting insights in the topic modeling for each of these clusters! Many of the topics the early 20s entry-level earners wrote about included self-discovery and self-care. Comparing the late 20s clusters, the average earners wrote more about immediate family and home, while high earners wrote more about socializing and self-care. Lastly, both mid 30s clusters wrote a lot about family, but the high earners included more about self-care.
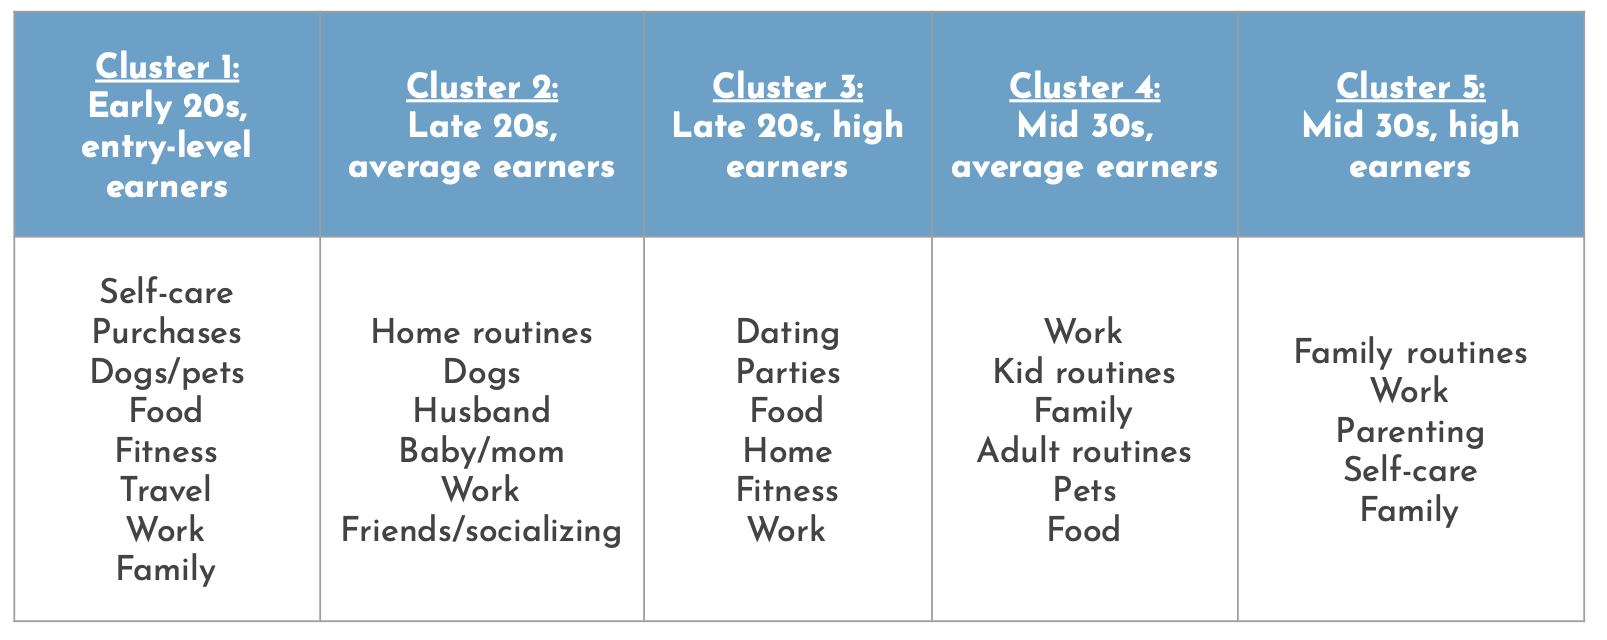
Figure 4: Identified topics for each of the 5 clusters
Recommender
I used my data and results to create a Money Diary Recommender using Streamlit. The recommender has the user input their age, salary, and a mini diary entry of what they did the previous day. It then uses the user’s age and salary to cluster them to the original diarists, and then based on the assigned cluster, performs cosine similarity on the diaries in the cluster and returns links to 3 diaries that are most similar to the user. My hope is that people will use this recommender and be inspired or learn some ideas on how to manage their finances.
If you haven’t already, go read some Refinery29 Money Diaries!
You can check out my code for my project on my Github.